Decoding Line Shifts: Capitalizing on Adjustments in Basketball and Football Fixtures
Written by Wendy Walter · Jul 28, 2026
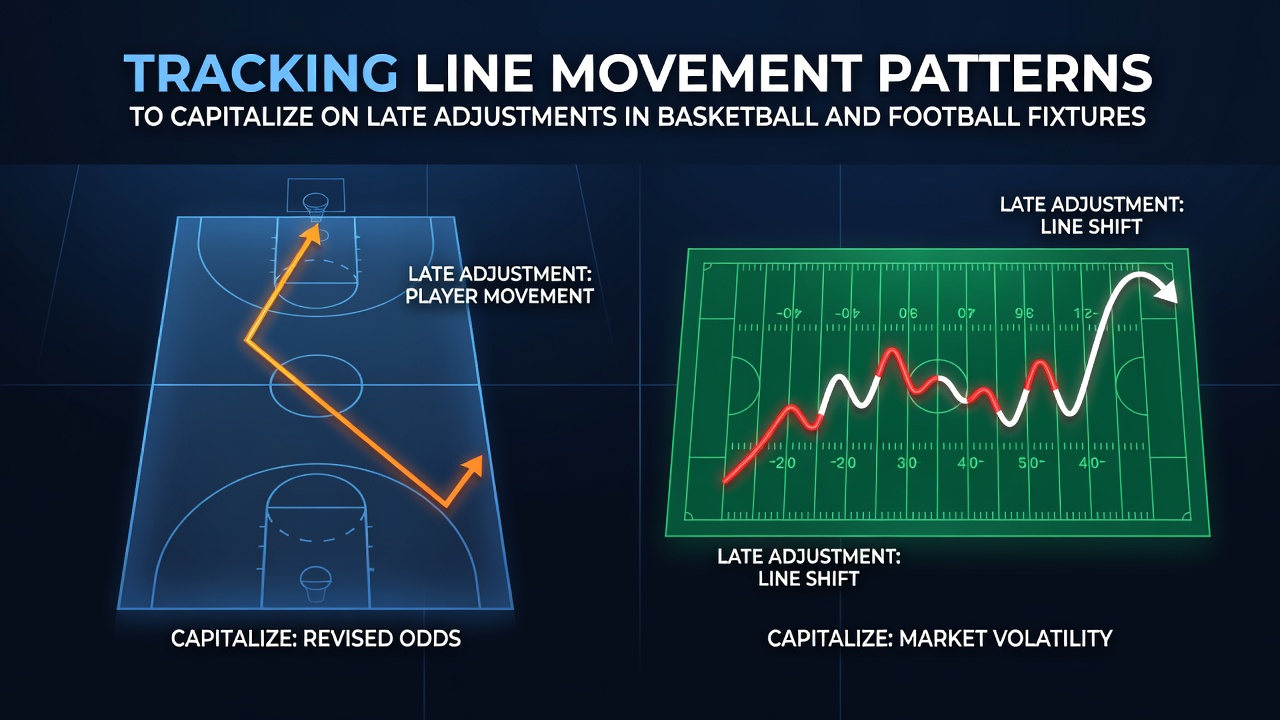
Decoding Line Shifts: Capitalizing on Adjustments in Basketball and Football Fixtures
Line movements in sports betting reflect the collective actions of bettors and oddsmakers responding to new information, and observers note that these shifts create identifiable patterns across basketball and football fixtures. Data from major sportsbooks indicate that lines typically open with initial projections based on team performance metrics, then adjust as wagering volume accumulates and external factors emerge. Researchers who have examined historical odds data find that sharp money often drives early movements, while recreational betting influences later stages, particularly in high-profile games.
Core Mechanics of Line Movement
Bookmakers set opening lines using statistical models that incorporate team efficiency ratings, player availability, and historical trends, yet these numbers rarely stay static once betting begins. When large wagers arrive from professional syndicates, lines shift to balance risk, and this process accelerates in basketball where point totals fluctuate with pace changes and in football where totals and spreads respond to weather updates or lineup confirmations. Studies from sports analytics groups reveal that approximately 60-70% of significant line movements occur within the final 24 hours before tip-off or kickoff, creating windows where late information can be leveraged.
Patterns emerge when comparing movement direction and timing. In basketball, lines frequently move toward the favorite after injury reports surface, while football spreads adjust more gradually when public money piles onto popular teams. Those who have analyzed multiple seasons of data observe that reverse line movement, where the line shifts opposite to heavy betting volume, often signals sharp action on the other side.
Basketball-Specific Patterns
Basketball fixtures generate rapid line adjustments because of the sport's high scoring and frequent roster changes. Data from NBA and college seasons show that player prop lines move dramatically on news of absences, with totals climbing or dropping by several points within hours. Observers tracking these changes note that late adjustments often occur after morning shootaround reports or when starting lineups are officially released, and these moments frequently produce measurable edges for bettors monitoring multiple sportsbooks simultaneously.
Examples from recent campaigns illustrate the point. One study of 2025-26 season games found that over/under totals in conference matchups moved an average of 3.2 points in the final six hours when key bench players were ruled out. In contrast, spreads in nationally televised games tended to stabilize earlier unless injury information arrived close to game time, highlighting how timing influences the value available through pattern recognition.
Football Fixture Dynamics
Football lines exhibit different rhythms, influenced by squad depth, travel schedules, and tactical adjustments announced closer to match day. Research on European leagues and domestic competitions indicates that spreads and totals move more steadily during the week, then accelerate after team news conferences on Fridays or Saturdays. Data collected through July 2026 shows that late line shifts in midweek fixtures often exceed two goals in total markets when weather forecasts change or when confirmed absences alter expected formations.
Those monitoring these movements point to consistent signals such as synchronized adjustments across multiple betting platforms, which frequently precede stronger results for the side receiving late support. In contrast, public-driven movements toward heavy favorites rarely produce sustained value once the line has already incorporated recreational volume.
Tools and Data Sources for Tracking
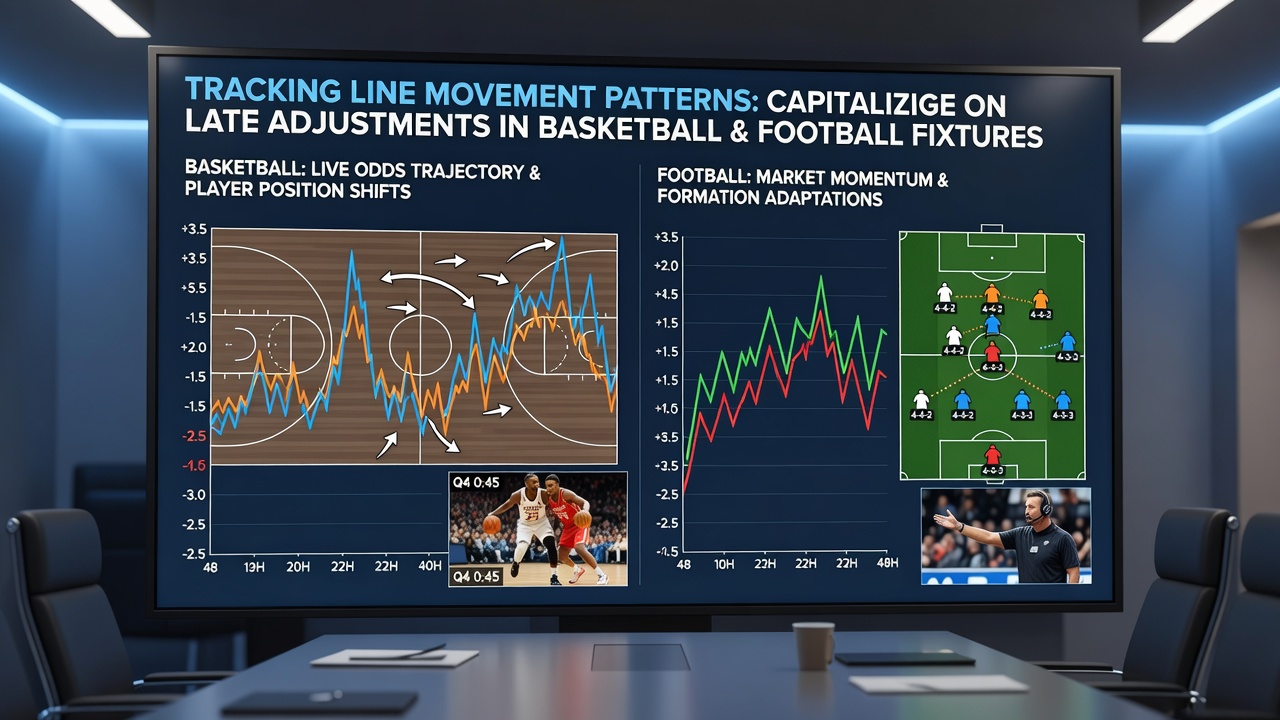
Modern bettors rely on software that aggregates odds from numerous operators and alerts users when movements exceed preset thresholds. According to reports from the American Gaming Association, increased use of real-time tracking tools has coincided with higher participation in live and pre-game markets during the 2025-26 period. Academic papers published by university research teams have documented that combining line movement data with injury feeds and advanced metrics improves identification of mispriced opportunities in both basketball and football.
Additional context comes from international regulatory summaries. Figures released by the Australian Communications and Media Authority highlight steady growth in sports betting activity, with line movement analysis cited as a contributing factor in how participants structure their approaches. These reports emphasize that transparent data access allows for systematic review of historical patterns without relying on anecdotal experience alone.
Practical Application in Fixtures
Applying these observations requires monitoring multiple indicators simultaneously. In basketball, attention to rapid total movements after practice reports can reveal where value has shifted. In football, watching for spread adjustments following press conferences often signals when oddsmakers have incorporated new tactical details. Analysts who have reviewed thousands of fixtures note that the most pronounced late adjustments occur in games involving teams with uncertain rotations or variable weather exposure, creating repeatable scenarios for pattern-based decisions.
Case examples from tracked seasons demonstrate that waiting for stabilization after initial sharp action, then entering positions aligned with the final direction of movement, aligns with positive long-term outcomes in aggregated data sets. This approach avoids chasing early volatility while capitalizing on the refined information reflected in closing lines.
Conclusion
Line movement tracking in basketball and football fixtures relies on systematic observation of timing, direction, and volume across betting markets. Data consistently shows that late adjustments incorporate the latest available information, and those who monitor these shifts gain access to updated probabilities reflected in the odds. Research from multiple sources confirms that combining movement alerts with verified external factors produces measurable structure for analyzing fixtures, while regulatory and industry reports continue to document the expanding role of data tools in sports wagering environments.