Performance Deviation Mapping: Refining Stake Adjustments in Multi-Market Live Environments
Written by Eden Hoffmann · Jul 10, 2026
Performance Deviation Mapping: Refining Stake Adjustments in Multi-Market Live Environments
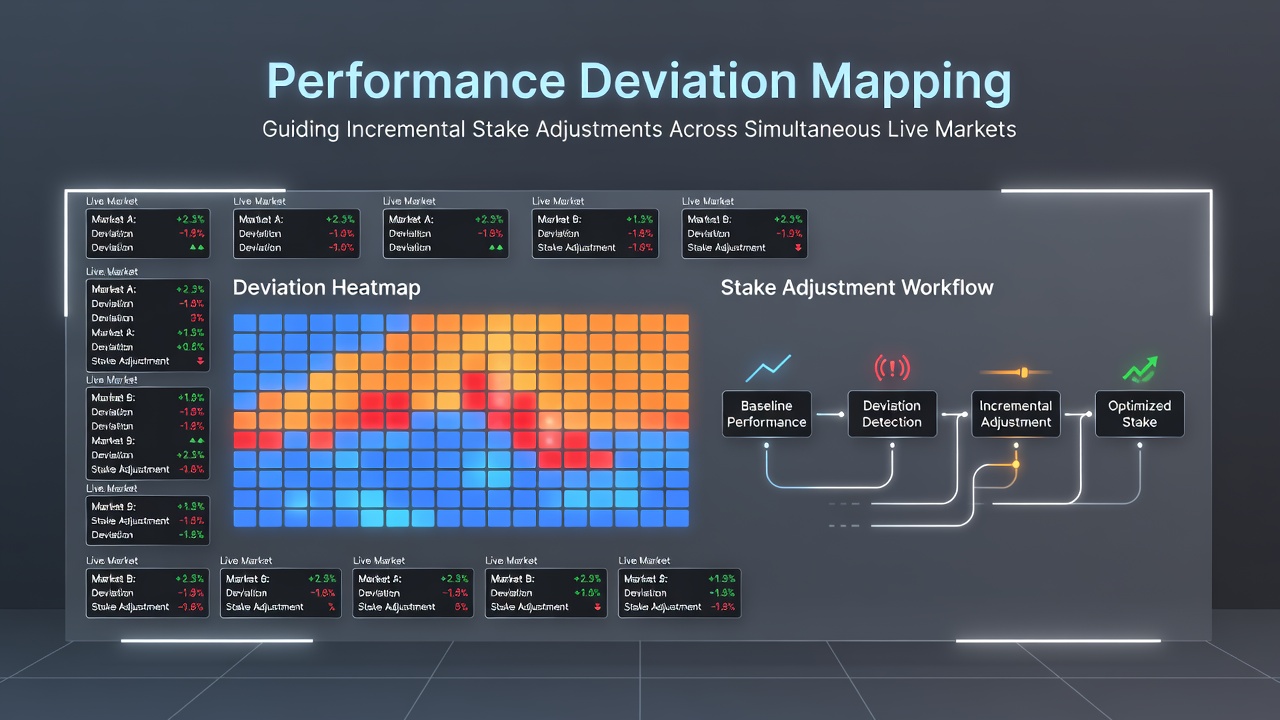
Performance deviation mapping tracks how actual outcomes stray from expected benchmarks during live events, and operators apply this data to fine-tune stakes across several markets at once. The approach relies on real-time feeds from sports analytics platforms that record metrics such as possession percentages, serve speeds, and pace indicators, then compare those numbers against pre-match models.
Core Mechanics of the Mapping Process
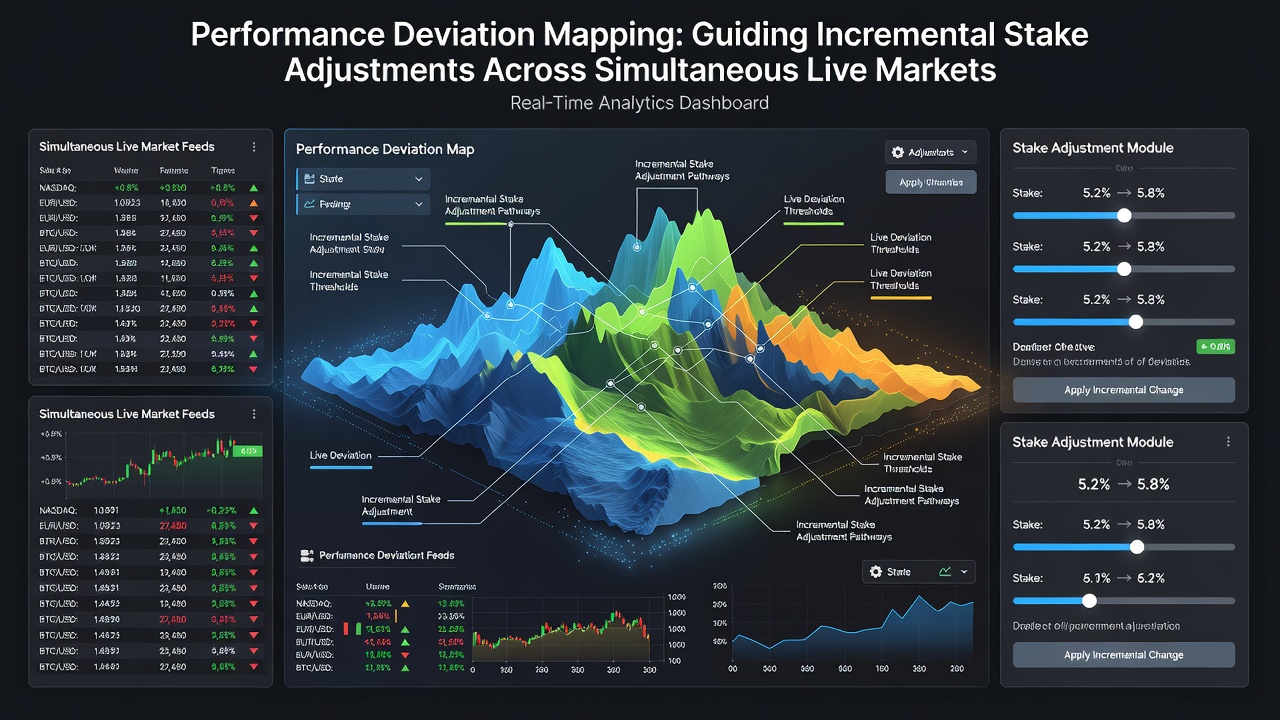
Systems assign each live market a deviation score calculated from the difference between observed performance and projected values, and traders update stake sizes in small increments when scores cross preset thresholds. Multiple markets run simultaneously in football, tennis, and basketball, so mapping software displays deviation lines side by side to prevent conflicting adjustments. Data arrives in sub-second intervals from official league providers, which allows continuous recalculation rather than periodic snapshots.
Application Across Simultaneous Markets
Traders working July 2026 schedules handle overlapping fixtures where a single player’s performance influences several derivative markets at the same time. A deviation spike in a tennis player’s first-serve percentage, for instance, triggers incremental stake increases on game-total markets while prompting reductions on set-winner lines if the same data point falls outside historical ranges. The mapping layer records each adjustment with a timestamp and market identifier, creating an audit trail that regulatory bodies in various jurisdictions review during compliance checks.
According to figures released by the American Gaming Association, live betting volumes in regulated U.S. states grew steadily through the first half of 2026, with multi-market sessions accounting for a rising share of handle. Mapping tools help operators segment that volume by deviation magnitude, separating routine fluctuations from statistically significant shifts that warrant stake changes.
Integration with Existing Risk Frameworks
Performance deviation mapping sits alongside existing exposure limits rather than replacing them, and risk teams set upper and lower boundaries that the mapping layer respects. When a deviation score exceeds those boundaries, the system pauses further stake increases until manual review occurs. This layered structure appears in platforms used by European operators who must satisfy both national licensing conditions and internal capital requirements.
Data Inputs and Model Calibration
Models draw from historical match files covering at least five seasons, plus granular event data collected during the current campaign. Calibration routines run weekly to incorporate new observations, and the updated coefficients feed back into live deviation calculations. Researchers at institutions such as the Singapore Management University have published working papers that examine how recalibration frequency affects the stability of deviation scores in high-volume markets.
Operators record the size and direction of each stake adjustment alongside the corresponding deviation value, then aggregate these records monthly to identify patterns. Markets that consistently require larger adjustments receive tighter threshold settings in subsequent periods, while stable markets allow wider tolerance bands.
Operational Workflows in July 2026
During peak July 2026 scheduling windows that feature concurrent tennis tournaments and pre-season football friendlies, trading desks allocate staff to monitor deviation dashboards grouped by sport. Alerts fire when two or more linked markets register opposing deviation signals, prompting a quick cross-check before further stake movement. The workflow keeps individual adjustments small, typically between two and five percent of the current stake, to limit cumulative exposure while the underlying performance trend develops.
Conclusion
Performance deviation mapping supplies a structured method for adjusting stakes across simultaneous live markets by quantifying how far observed metrics depart from model expectations. The technique integrates with existing risk controls, draws on calibrated data feeds, and produces documented adjustment trails that satisfy regulatory oversight in multiple regions. As live betting volumes continue to expand, the mapping layer offers one documented approach for maintaining consistency when traders manage overlapping positions.