Referee Tendency Mapping Cuts Overround Exposure in Domestic Cup Fixtures
Written by Wendy Walter · Aug 7, 2026
Referee Tendency Mapping Cuts Overround Exposure in Domestic Cup Fixtures
Referee tendency mapping collects historical decision data across thousands of cup matches and converts those patterns into probability adjustments that lower the bookmaker's built-in margin; analysts track card rates, penalty awards, and stoppage-time distributions by official, competition stage, and team style while domestic cups such as the Copa del Rey or DFB-Pokal provide the repeated matchups that make the data reliable.
Core Components of Tendency Mapping
Each referee receives a profile built from variables including yellow cards per ninety minutes, fouls awarded to home versus away sides, and the frequency of red-card decisions after the seventy-fifth minute; researchers combine these figures with venue-specific and time-of-season filters because cup ties often feature extra time and variable crowd sizes that alter behavior. Data sets grow rapidly in August when new seasons begin and early-round fixtures multiply across multiple countries, allowing fresh observations to update models before later knockout stages begin.
Data Sources and Geographic Spread
National football federations release match logs that feed the models, while academic groups at institutions such as the University of Groningen publish peer-reviewed studies on referee consistency across European domestic cups; analysts also draw from the Australian Sports Commission performance reports that detail officiating metrics in the Australia Cup, creating a cross-continent baseline that avoids reliance on any single regulator. The resulting profiles show measurable differences between referees who officiate primarily in league play and those who handle cup ties, where fatigue and fixture congestion change decision thresholds.
Application to Overround Reduction
Bookmakers embed an overround typically between 2 % and 5 % in cup markets; tendency mapping identifies markets where referee-specific probabilities diverge from the published odds, allowing bettors to construct adjusted probabilities that shrink the effective margin. For example, officials who award 0.8 more penalties per ten matches than the competition average create measurable value in both-teams-to-score lines once the mapping layer is applied, because those officials also show elevated stoppage time that extends scoring windows. Models recalculate the implied probability for each outcome, subtract the referee-adjusted expectation, and compare the result against the offered price to isolate selections where the residual overround falls below 1 %.
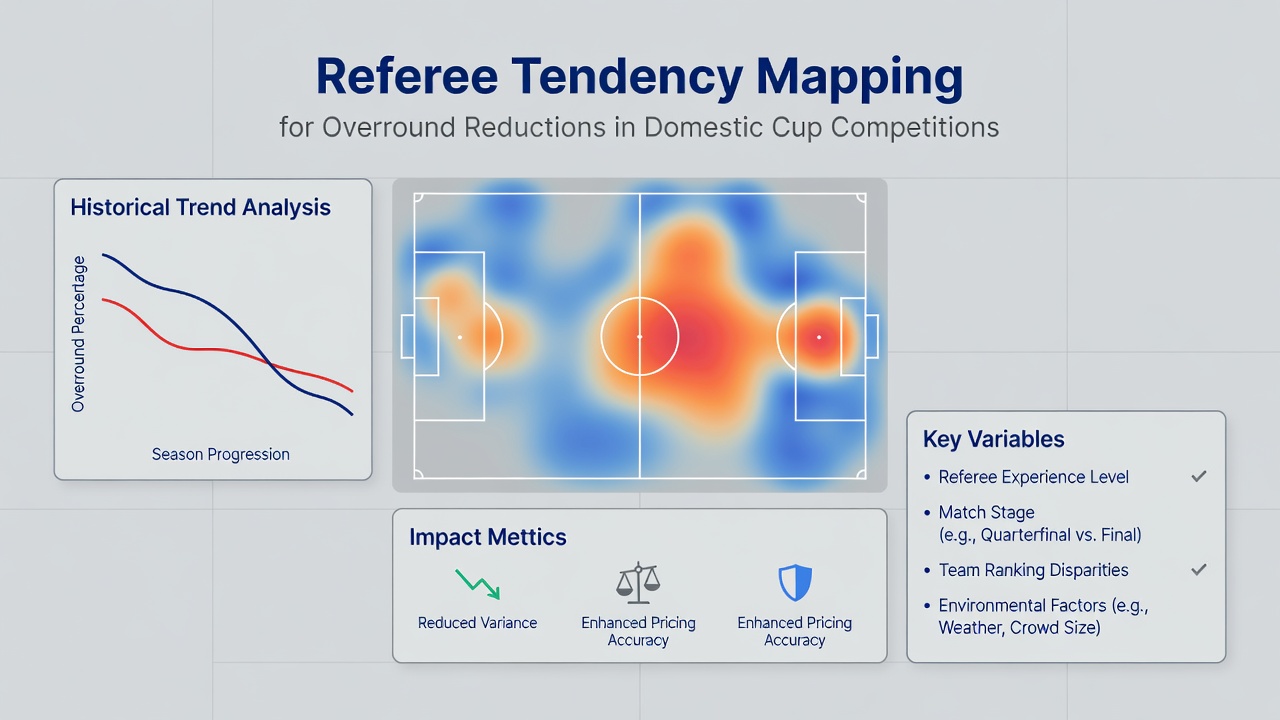
Implementation requires continuous scraping of official reports and rapid integration of new matches; teams that maintain these pipelines update profiles after every round so that quarter-final and semi-final fixtures carry the most recent tendencies rather than season-long averages.
Observed Patterns Across Competitions
Studies from the Journal of Quantitative Analysis in Sports document that referees in Spanish domestic cups issue 12 % fewer cards in extra time than their league counterparts, while German cup officials show the opposite trend with higher dismissal rates after the ninetieth minute; these differences persist across multiple seasons and remain statistically significant after controlling for team strength and travel distance. Observers note that home teams in cup ties receive 0.3 additional penalties per match under officials who average above 4.5 cards per game, a pattern that alters both handicap and total-goals pricing once the mapping adjustment is applied.
Integration With Existing Betting Workflows
Traders incorporate referee profiles as an additional input layer alongside expected-goal models and travel-fatigue metrics; the combined output produces revised odds that reflect the interaction between playing style and officiating bias. Because cup draws create unbalanced fixtures more frequently than league schedules, the referee layer often accounts for a larger share of the edge than in weekly league betting, where squad rotation already dominates variance.
Conclusion
Referee tendency mapping supplies a repeatable method for extracting probability adjustments that directly address overround inflation in domestic cup competitions; the approach relies on publicly available match data, academic validation, and cross-regional comparisons to maintain accuracy as seasons progress. Continued collection of August 2026 fixtures will further refine the profiles ahead of later knockout rounds, ensuring the adjustments remain current for markets that reset with every new draw.