Resource Allocation Mapping Techniques for Spotting Edges in Live Football and Racing Markets

Resource allocation patterns shift constantly during live football matches and racing events, creating measurable opportunities for those who track how energy, positioning, and tactical assets spread across the field or track. Observers note that teams and jockeys manage finite resources like stamina reserves, spatial control, and recovery windows, while data analytics platforms now capture these movements in real time through wearable sensors and optical tracking systems.
Studies from performance labs show that football squads often redistribute defensive resources after the 60-minute mark, with fullbacks pushing higher to compensate for midfield fatigue. This redistribution leaves exploitable gaps in wide areas when opposing forwards retain fresh legs. Racing data collected across European tracks reveals similar dynamics, where early pace setters expend disproportionate energy in the first half of a race, allowing closers to conserve resources for the final furlongs.
Core Components of Resource Mapping Models
Effective mapping starts with identifying primary resource categories: physical output measured in meters per minute, cognitive decision speed under pressure, and spatial territory controlled at any given moment. Software platforms integrate GPS data with heart rate variability to build heat maps that highlight depletion zones. Analysts then layer these maps against historical performance benchmarks to flag when a player or horse deviates from expected recovery curves.
One study conducted by researchers at a Canadian sports institute demonstrated that midfielders who cover above-average distances in the opening 30 minutes show a 22 percent drop in high-intensity sprints after the hour mark. Racing analysts apply parallel logic when monitoring stride length and ground coverage, noting that horses maintaining even tempo distributions tend to sustain closing speeds better than those who surge early.
Application in Evolving In-Game Football Scenarios
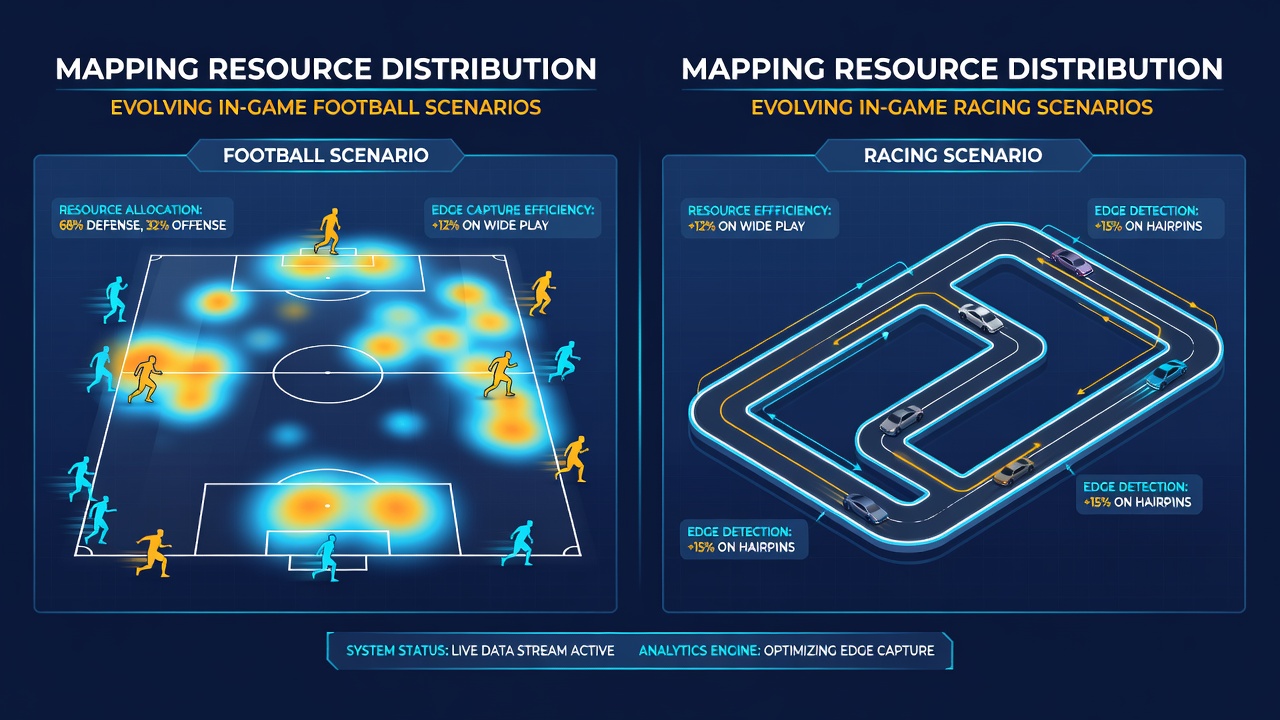
Live football markets respond quickly to visible resource imbalances, particularly during substitutions or tactical adjustments around the 70th minute. Mapping tools allow observers to quantify how a team’s pressing intensity declines when two central defenders have already accumulated high workload totals. This information feeds into probability models that adjust expected goal values based on remaining stamina pools rather than static formations alone.
Matches played in June 2026 across major European leagues featured extended fixture congestion, with several clubs playing three games in eight days. Resource tracking during those windows revealed that squads rotating two or more players at halftime maintained higher territorial control percentages in the final 20 minutes compared with unchanged lineups. Such patterns appear consistently in aggregated match files released by league technology partners.
Parallel Techniques for Racing Event Analysis
Horse racing presents a compressed timeline for resource mapping, yet the principles remain consistent. Jockey positioning decisions directly influence how a runner distributes effort across sections of the course. Data collected from Australian thoroughbred meetings indicates that horses traveling three-wide on the turn expend 15 percent more energy than those enjoying rail runs, even when overall finishing times appear similar. Bettors who monitor sectional splits alongside real-time pace maps can identify when early leaders have already committed too much resource to maintain position.
Weather variables further complicate distribution patterns, since soft ground increases energy cost per stride. Mapping systems now incorporate ground condition sensors to adjust baseline models dynamically, allowing for more accurate projections of when a favored runner will fade relative to rivals that conserve early speed.
Integration with Broader Performance Datasets
Combining resource maps with traditional statistics such as pass completion rates or strike rates produces richer insight layers. A European racing authority report from 2025 highlighted how trainers who adjust training loads based on previous race sectional data achieved higher win percentages in subsequent starts, particularly when horses returned within 14 days. Football academies apply analogous methods, using youth match footage to teach players how to read opponent fatigue signals and shift attacking resources accordingly.
Academic papers published through sports science journals continue to refine these models by incorporating machine learning layers that predict resource tipping points several minutes ahead. The approach moves beyond simple averages toward individualized baselines that account for age, recent workload, and positional demands.
Conclusion
Resource distribution mapping has become a standard analytical layer for anyone examining live football and racing markets. By tracking how physical and positional assets evolve throughout an event, analysts generate updated probability estimates that reflect actual conditions rather than pre-match assumptions. Continued refinement of sensor technology and data integration methods ensures these techniques will keep pace with the increasingly granular demands of modern performance analysis.