Statistical Insights from Greyhound Traps Informing Matched Betting Portfolio Strategies
Written by Eden Jung · Jun 28, 2026
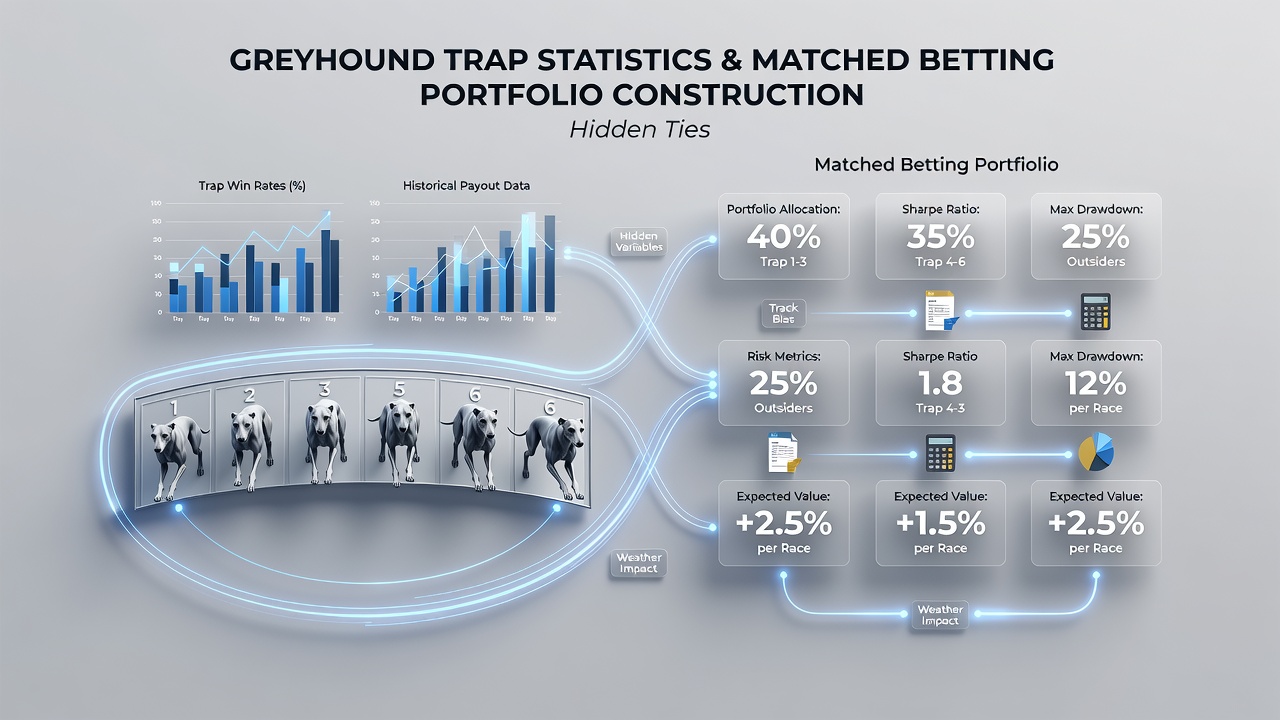
Statistical Insights from Greyhound Traps Informing Matched Betting Portfolio Strategies
Greyhound trap statistics provide detailed performance records across starting positions at tracks worldwide, and analysts apply these metrics when constructing matched betting portfolios that balance exposure across multiple events. Data from various racing jurisdictions shows consistent patterns in trap advantages, particularly at distances between 300 and 500 metres, where inside traps often record higher strike rates due to shorter paths to the first bend.
Core Trap Performance Patterns
Track records compiled over thousands of races indicate trap one maintains win percentages around 18 to 22 percent at many venues, while trap six frequently falls below 12 percent in the same sample sets. Researchers at racing data organisations have mapped these differentials across seasons, noting that rail bias strengthens on tighter circuits yet weakens on wider layouts where outside runners gain early momentum. Those who study these figures incorporate the information into selection filters that identify value opportunities for matched betting activities.
June 2026 data releases from several international bodies confirmed these historical trends persisted through the preceding twelve months, with minor adjustments at resurfaced tracks. Observers note that such consistency allows portfolio managers to model expected outcomes more precisely when pairing lay and back positions on betting exchanges.
Integration with Matched Betting Mechanics
Matched betting relies on simultaneous back and lay wagers to lock in returns regardless of outcome, yet variance still arises from event selection and stake sizing. Trap statistics enter this process when operators screen greyhound meetings for races where trap biases create measurable edges in starting prices. A dog drawn in trap two at a venue with documented inside advantage might attract shorter odds than its true probability warrants, creating conditions where matched positions can be scaled across several races without overlapping risk factors.
Portfolio construction benefits when selections span different tracks and distances because trap effects vary by configuration. One approach involves allocating portions of available capital to events at venues with opposing biases, such as combining a meeting favouring rails with another that rewards wide runners. This diversification reduces the impact of any single anomalous result on overall returns.
Quantitative Models in Practice
Statistical models built from trap data often employ regression analysis to predict adjusted probabilities after accounting for field strength and recent form. Industry reports from organisations like Greyhound Racing Victoria demonstrate how these adjusted figures feed into stake calculators used in matched betting workflows. The resulting portfolios typically feature staggered entry points across evening and afternoon programmes, limiting simultaneous exposure while maintaining consistent throughput.

Academic studies published in journals focused on gambling mathematics have examined correlations between trap performance and market inefficiencies. Findings indicate that public bettors tend to overvalue outside draws in certain conditions, which creates temporary mispricings that matched betting systems can exploit through automated screening tools. These systems flag qualifying races and suggest position sizes calibrated to each trap's historical contribution to variance.
Geographic and Regulatory Context
Regulatory frameworks in Australia and parts of Europe require publication of detailed performance statistics, enabling broader access to trap-level data for analytical purposes. Greyhound Racing Victoria maintains open datasets that extend back multiple years, supporting longitudinal studies of bias stability. Similar repositories operated by North American state commissions provide comparative benchmarks, revealing that American tracks exhibit flatter trap distributions owing to longer straights and different lure systems.
Portfolio managers operating across jurisdictions therefore reference multiple sources when building international greyhound allocations. This cross-border perspective helps account for seasonal variations, such as summer surface changes that alter trap dynamics at outdoor facilities.
Practical Implementation Steps
Operators begin by importing trap statistics into spreadsheets or dedicated software, then apply filters for minimum race counts and distance ranges. Next they calculate implied probabilities from current odds and compare them against model outputs derived from trap data. Positions are opened only when discrepancies exceed predefined thresholds, ensuring each matched pair contributes positively to the portfolio's expected value. Ongoing monitoring tracks realised versus predicted outcomes, prompting periodic recalibration of trap weightings as new results accumulate.
Case examples from betting syndicates illustrate how trap-informed selections reduced drawdown periods during volatile months. One documented sequence involved rotating between Irish tracks with pronounced rail advantages and UK venues showing more even distributions, resulting in steadier monthly performance metrics.
Conclusion
Greyhound trap statistics supply measurable inputs that enhance the construction of matched betting portfolios through improved race selection and risk distribution. Continued data collection across global racing circuits supports refinement of these approaches, while regulatory transparency in multiple regions sustains access to the underlying records. Those who integrate trap metrics systematically observe structured patterns that align with the mechanical requirements of matched betting operations.