Strategic Timing in Dual-Sport Markets: Managing Overlapping Windows Across Football and Basketball
Football leagues and basketball competitions frequently share calendar space throughout the year, creating periods when multiple high-value betting markets open simultaneously. Observers note that these overlaps demand careful coordination of stake allocation to prevent concentrated risk in any single outcome cluster. Data from major sports calendars show that May often brings the tail end of European domestic seasons alongside the NBA playoffs and early international basketball windows, producing dense clusters of live and pre-match opportunities.
Those who track fixture lists point out that English Premier League fixtures, UEFA competitions, and NBA postseason games can land within the same 48-hour blocks. Exposure management in such windows relies on mapping each market's volatility profile against available bankroll segments. Research from sports analytics groups indicates that pre-match football lines typically move more slowly than basketball totals during live play, allowing staggered entry points when both sports run concurrently.
Mapping Calendar Overlaps
League schedulers release fixtures months in advance, yet last-minute postponements and playoff adjustments still occur. Analysts who compile cross-sport timelines combine data from domestic federations, continental bodies, and professional associations to flag high-density periods. One documented pattern shows that when Champions League midweek matches coincide with NBA conference finals, total available markets can exceed 300 distinct lines within a single evening across major operators. Balanced exposure requires splitting capital according to each sport's historical variance rather than equal weighting.
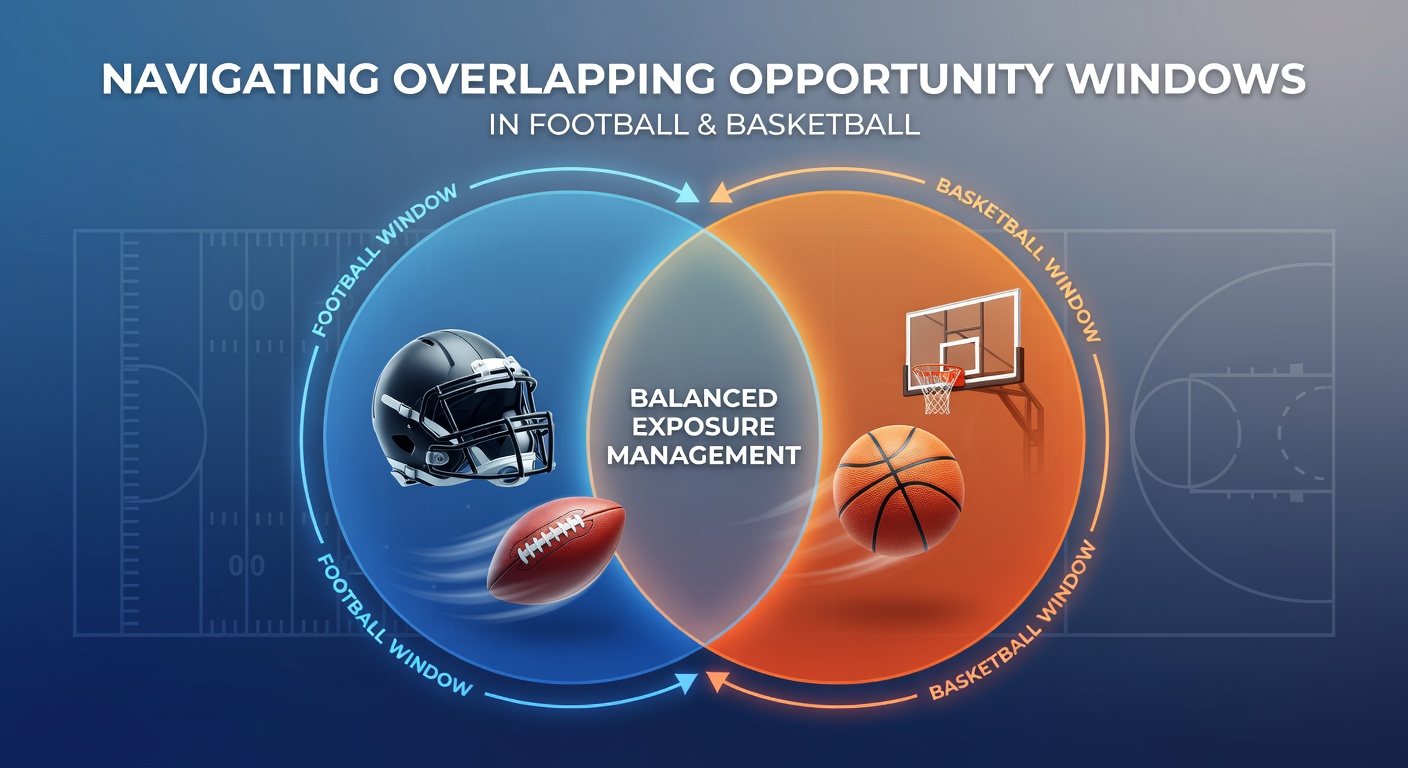
Allocation Frameworks During Shared Windows
Practitioners apply exposure caps that reset daily across both sports. They track cumulative liability on correlated outcomes, such as high-scoring basketball games and over-total football matches that may share similar variance drivers like weather or travel fatigue. Studies of professional bettors reveal that dynamic rebalancing every four hours during peak overlap reduces drawdown frequency compared with static daily limits. Software platforms now integrate multi-sport feeds that flag when projected market liquidity drops below preset thresholds in either sport.

Coordinators also monitor line movement velocity. Basketball in-play totals shift rapidly after timeouts or injury substitutions, while football Asian handicap lines react more gradually to red cards or substitutions. Those managing dual portfolios often enter basketball positions first during live windows, then layer football bets once basketball volatility subsides, thereby spreading execution risk across time rather than concentrating it.
Regulatory and Platform Considerations
Operators in multiple jurisdictions impose session-based exposure rules that span all sports offered on a single account. Figures released by the Victorian Responsible Gambling Foundation highlight how cross-sport activity monitoring helps identify rapid stake escalation during overlapping events. Platforms licensed under the Irish Revenue Commissioners gambling framework require aggregated reporting that treats football and basketball liabilities as a single portfolio for responsible gambling triggers.
May 2026 schedules already show preliminary clustering around the final weeks of several European leagues and the NBA postseason, with international basketball windows adding further density. Market makers adjust limits accordingly, and data providers supply real-time correlation matrices that flag when football and basketball outcomes share statistical dependencies through common external factors such as player fatigue cycles.
Practical Execution Tactics
Execution teams segment bankrolls into sport-specific tranches that can be reallocated mid-window if one market closes or liquidity dries. They log each entry with timestamped exposure values, enabling post-session review of how overlapping entries performed relative to isolated ones. Case examples from industry reports demonstrate that traders who maintain separate live dashboards for each sport reduce simultaneous open positions by approximately 30 percent during peak overlap compared with single-dashboard approaches.
Conclusion
Effective navigation of overlapping opportunity windows in football and basketball rests on systematic calendar mapping, time-phased execution, and cross-sport exposure aggregation. Data-driven allocation models and platform-level monitoring continue to evolve, providing clearer visibility into how simultaneous markets interact. Those maintaining disciplined segmentation across both sports record more stable performance metrics during high-density calendar stretches.