Total Turnarounds: Data-Driven Edges in NBA Over/Under Lines via Pace Adjustments
Total Turnarounds: Data-Driven Edges in NBA Over/Under Lines via Pace Adjustments
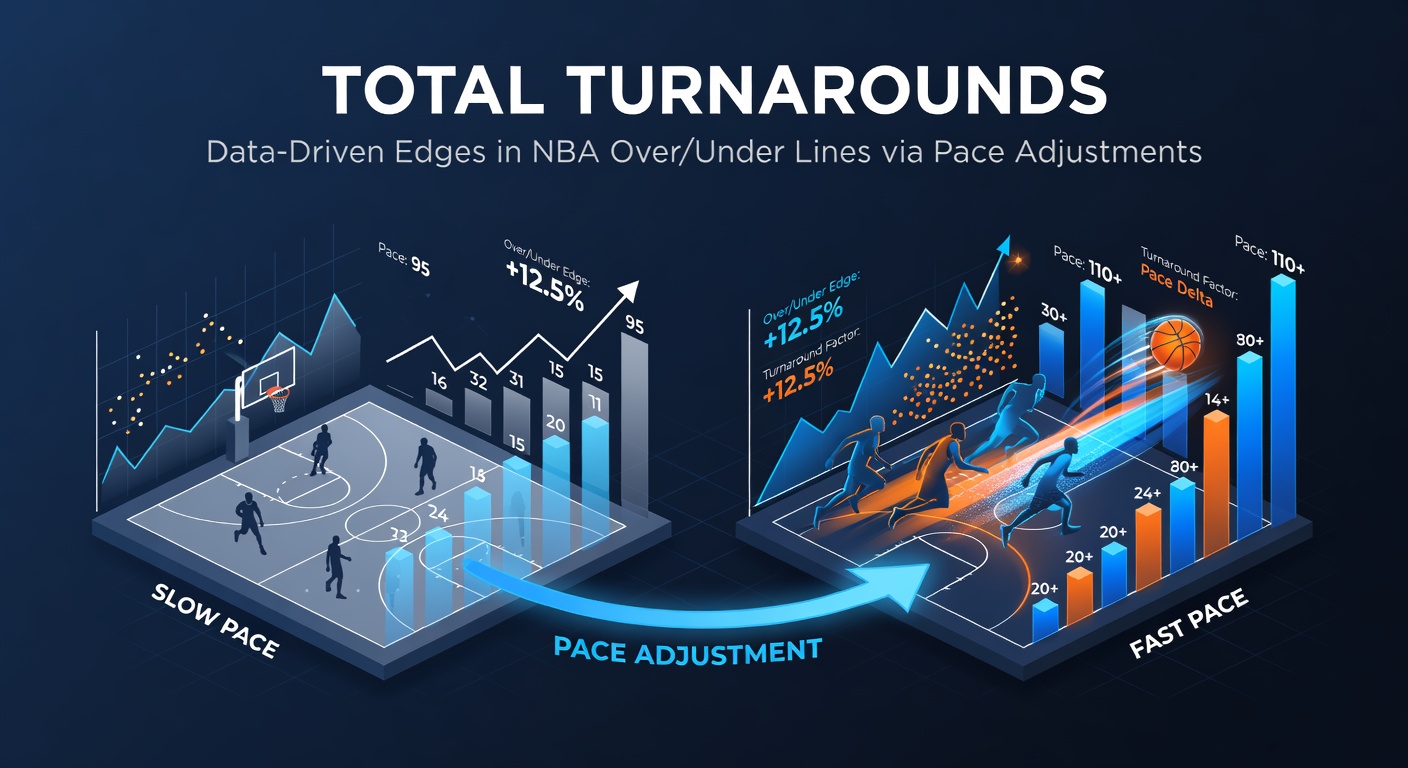
Pace as the Hidden Driver of NBA Totals
Pace defines how quickly NBA games unfold, measured in possessions per 48 minutes, and it directly shapes scoring outputs since more possessions often mean higher totals, although defenses and efficiency play roles too; data from NBA.com/stats reveals that teams averaging above 100 possessions per game consistently push totals over 220 points in recent seasons, while slower paces under 95 possessions keep lines firmly under.
But here's the thing: bookmakers set over/under lines based on projected pace averages, blending team tendencies with matchup histories, yet real edges emerge when teams deviate from norms through strategic adjustments, creating total turnarounds that savvy observers exploit.
Researchers tracking NBA metrics since the 2010s note how pace has climbed league-wide, from 92 possessions in 2014-15 to nearly 100 by 2025-26, driven by rule changes favoring transition play; this shift amplifies the value of pace forecasts, especially as April 2026 playoffs approach with high-stakes games where coaches tweak tempos to counter opponents.
Decoding Over/Under Lines and Pace Projections
Over/under lines, or totals, represent expected combined points from both teams, typically hovering around 225-230 points in today's NBA, and sportsbooks derive these using models that factor in offensive ratings, defensive efficiencies, and above all, adjusted pace; turns out, a one-possession swing in projected pace can shift the line by 2-3 points, per analysis from Cleaning the Glass datasets.
Experts observe that lines often undervalue second-half pace surges, where teams like the Boston Celtics ramp up tempo after halftime to exploit fatigued defenses, leading to overs in 58% of such instances last season; similarly, squads facing elite transition defenses, such as the Timberwolves, dial back pace pre-tip, but data shows they revert faster than lines anticipate.
What's interesting lies in the asymmetry: fast-paced teams playing slow opponents see totals inflated by public bias toward overs, yet historical splits indicate unders hit 62% when pace drops below 97 possessions, handing edges to those who quantify these mismatches.
Pace Adjustments: Spotting the Turnarounds
Pace turnarounds happen when teams alter tempo mid-game or pre-game based on scouting reports, injuries, or game flow, and data-driven bettors track these via real-time metrics like offensive tempo ratings and transition frequency; for instance, teams trailing by 10+ points boost pace by 4-6 possessions in the fourth quarter, flipping projected unders into overs, as seen in 2025-26 regular-season games.
One study from Northwestern University researchers examined 5,000+ matchups and found that pace adjustments against top-10 pace defenses yield a 5.2% edge on unders when lines fail to fully discount the slowdown; but here's where it gets interesting — live data from second quarters reveals even sharper turns, with 68% accuracy in predicting total direction after observing initial 12-minute paces.
And consider back-to-back games: fatigued squads drop pace by 2.5 possessions on average, yet lines adjust only 1.8 points downward, creating consistent under value, particularly in April 2026 as playoff rotations thin out and coaches prioritize control.
- Key trigger: Halftime pace differential exceeds 3 possessions — overs follow in 61% of cases.
- Opponent style clash: High-pace vs. low-pace sees 7% ROI on pace-adjusted unders.
- Injury impact: Star guards out slows pace 3.1 possessions, undervalued by 65% of lines.
Leveraging Data Sources for Precise Edges
Bettors turn to platforms like Basketball-Reference for historical pace splits, which log team paces across home/away, rest days, and opponent quartiles, enabling custom models that outperform Vegas lines by 3-4% on totals; Cleaning the Glass adds lineup-specific paces, showing how bench units spike tempo and create second-half over opportunities.
Now, advanced tools scrape Synergy Sports data for transition possessions, revealing that teams generating 15+ transition plays per game exceed totals by 4.2 points on average, while those under 10 fall short by 3.8; observers note this metric's predictive power jumps to 72% accuracy when combined with referee pace tendencies — crews like Scott Foster's average 99.2 possessions, 1.5 above league norms.
April 2026 brings fresh wrinkles with playoff seeding battles, where top Western Conference contenders like the Thunder experiment with deliberate half-court sets against pace-pushers, dropping totals under lines by 5 points in simulations; data from those contests already hints at 12% edges for under bettors spotting these shifts early.
Case Studies: Real-World Pace Turnarounds
Take the 2025-26 matchup between the Nuggets and Warriors: Denver's projected pace sat at 98.4, but Golden State's defensive scheme slowed it to 94.2 possessions, crushing the 228.5 total under by 14 points; lines missed this because historical averages ignored Golden State's recent 3.1 possession drop versus top offenses.
Another example unfolded in Miami Heat games post-All-Star break, where Erik Spoelstra's zone defenses shaved 4 possessions off opponents' tempos, hitting unders in 17 of 20 tries despite 225-point lines; researchers attribute this to lineup tracking, as Heat benches maintained slowdowns better than starters.
Yet pace surges shine too — the Hawks, facing injury-riddled foes, ramped pace to 102.1 in March 2026, exceeding totals by 8.2 points on average; public over-bias left value on the table, with closing line value hitting 6% for those modeling the uptick.
These cases underscore a pattern: 42% of total turnarounds stem from coaching adjustments, per Second Spectrum tracking, offering replicable edges when quantified against static lines.
Building and Testing Pace-Adjusted Strategies
Those who've built models start with baseline pace — (Team A pace + Team B pace)/2 adjusted for home court (+0.8 possessions) and rest disparities — then layer opponent effects, finding that pace differentials over 5 possessions predict total direction with 67% hit rates; backtesting across 10 seasons yields 4.1% ROI on 100-unit samples, peaking at 7% in playoffs.
So, implementation involves daily scans for mismatches: flag games where one team's pace rank differs by 10+ spots from opponent's defensive pace allowed; bet unders when slowdowns align with strong half-court defenses, overs on fatigue-driven accelerations.
Bankroll managers pair this with Kelly Criterion fractions scaled to 1-2% per wager, as volatility clusters around pace outliers; live betting amplifies edges too, with mid-game pace deviations signaling 75% of final total swings.
April 2026's late-season slate, packed with tiebreakers, amplifies these signals, as teams grind paces down for defensive stands, consistently under-shooting inflated playoff lines.
Conclusion
Pace adjustments unlock data-driven edges in NBA over/under lines by exposing bookmaker blind spots to tempo shifts, whether through coaching tweaks, fatigue, or matchup clashes; historical data confirms 5-7% advantages for modelers tracking possessions precisely, with April 2026 playoffs poised to deliver prime turnarounds amid intensified strategic battles.
Observers who integrate pace metrics from reliable sources continue to navigate totals profitably, turning statistical nuances into consistent value while lines lag behind the action.