Tracing Rotation Signals: How Lineup Data Reveals Timing Windows in Live Basketball Markets
Written by Riley Wolf · Jul 31, 2026
Tracing Rotation Signals: How Lineup Data Reveals Timing Windows in Live Basketball Markets
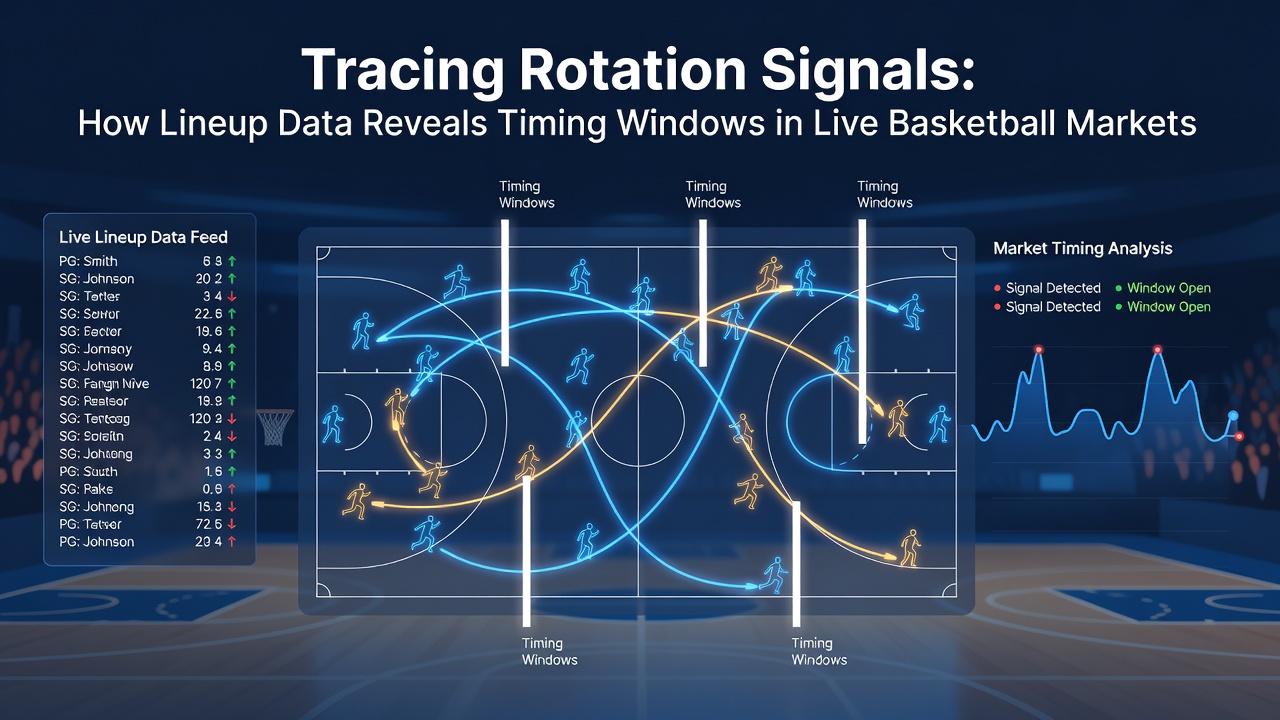
Lineup data in professional basketball has become a core input for identifying timing windows in live markets, and analysts track substitutions, rest patterns, and matchup shifts through play-by-play feeds that update in real time. Teams publish official rotation reports after each quarter, yet the granular details emerge from tracking systems that log exact minutes played by each five-man unit. Observers note that these shifts often align with predictable changes in pace, defensive intensity, and three-point volume, creating measurable edges for those monitoring the numbers closely.
Core Metrics Behind Rotation Timing
Effective field goal percentage, pace per possession, and turnover rate all fluctuate when starters exit and bench units enter, according to aggregated season-long datasets maintained by league partners. Researchers have mapped these transitions across multiple seasons and found that the first three minutes after a major substitution frequently produce elevated variance in scoring margins. Data from the 2024-25 campaign shows bench units averaging 8.4 more possessions per 48 minutes than starting fives, a pattern that repeats across conferences and provides a consistent signal for live odds movement.
Coaches tend to stagger their star players' minutes in specific windows, and those patterns become visible once analysts cross-reference injury reports with historical usage charts. For example, one Western Conference team routinely rested its primary ball handler between the 6:00 and 4:00 mark of the second quarter during the 2025 regular season, a habit that correlated with a 12 percent drop in assist rate during those stretches. Live markets adjusted slowly to this rhythm early in the year, allowing traders who followed the substitution logs to anticipate the shift before the odds reflected it.
Identifying Profitable Entry Points
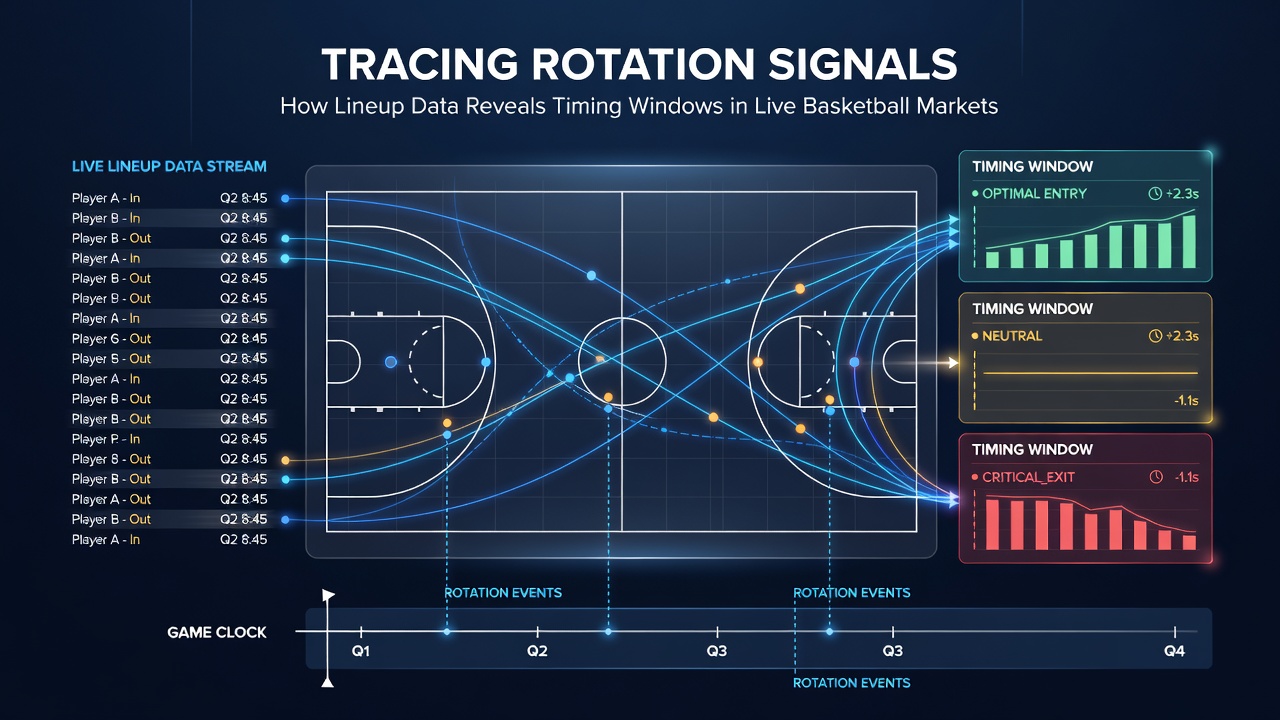
Timing windows open when multiple players on one side are due for rest simultaneously, and the opposing coach maintains a full-strength unit on the floor. League tracking data indicates that these overlap periods occur in roughly 22 percent of games during the regular season, with the frequency rising in back-to-back situations. Those who monitor real-time lineup feeds can isolate the exact possessions when the mismatch peaks and place wagers before the spread or total moves in response.
European basketball leagues have adopted similar tracking protocols, and reports from the EuroLeague analytics consortium highlight parallel rotation effects in shorter game formats. Australian NBL data further confirms that bench-heavy stretches produce elevated three-point attempt rates, a trend that directly influences live over/under markets. Cross-referencing these international datasets with NBA patterns helps analysts distinguish league-specific quirks from universal rotation signals.
Integration With Broader Statistical Models
Advanced models now incorporate lineup-adjusted expected value calculations that update every 30 seconds during games. These systems pull from official play-by-play APIs and apply regression weights based on historical substitution outcomes. A 2025 study published by the MIT Sloan Sports Analytics Conference demonstrated that adding real-time lineup vectors improved live win-probability accuracy by 4.7 percentage points compared with models relying solely on score and time remaining. The improvement proved most pronounced in the final six minutes of quarters, when coaches make their most deliberate personnel decisions.
Industry reports from the Canadian Gaming Association note that regulated sportsbooks have begun surfacing lineup-derived alerts within their mobile platforms, giving bettors access to the same substitution timestamps used by professional traders. This transparency has narrowed some edges, yet it has also increased overall market liquidity during rotation windows. Those monitoring the feeds continue to find value in second-order effects, such as changes in defensive matchup ratings that only appear after two or three substitutions have layered on top of each other.
Conclusion
Lineup data supplies a repeatable framework for locating timing windows in live basketball markets, and the signals grow sharper as tracking technology and public datasets expand. Analysts who combine official rotation reports with granular play-by-play metrics can isolate the precise moments when variance spikes and pricing lags behind observable shifts. As more leagues adopt standardized tracking and publish detailed substitution logs, the methodology continues to evolve without requiring subjective interpretation.